Infographics
[fa-share]These infographics were produced by HDC in collaboration with partners. Feel free to share these infographics via social media or print them out and distribute them at your events. Let us know on Facebook or Twitter how you use them!
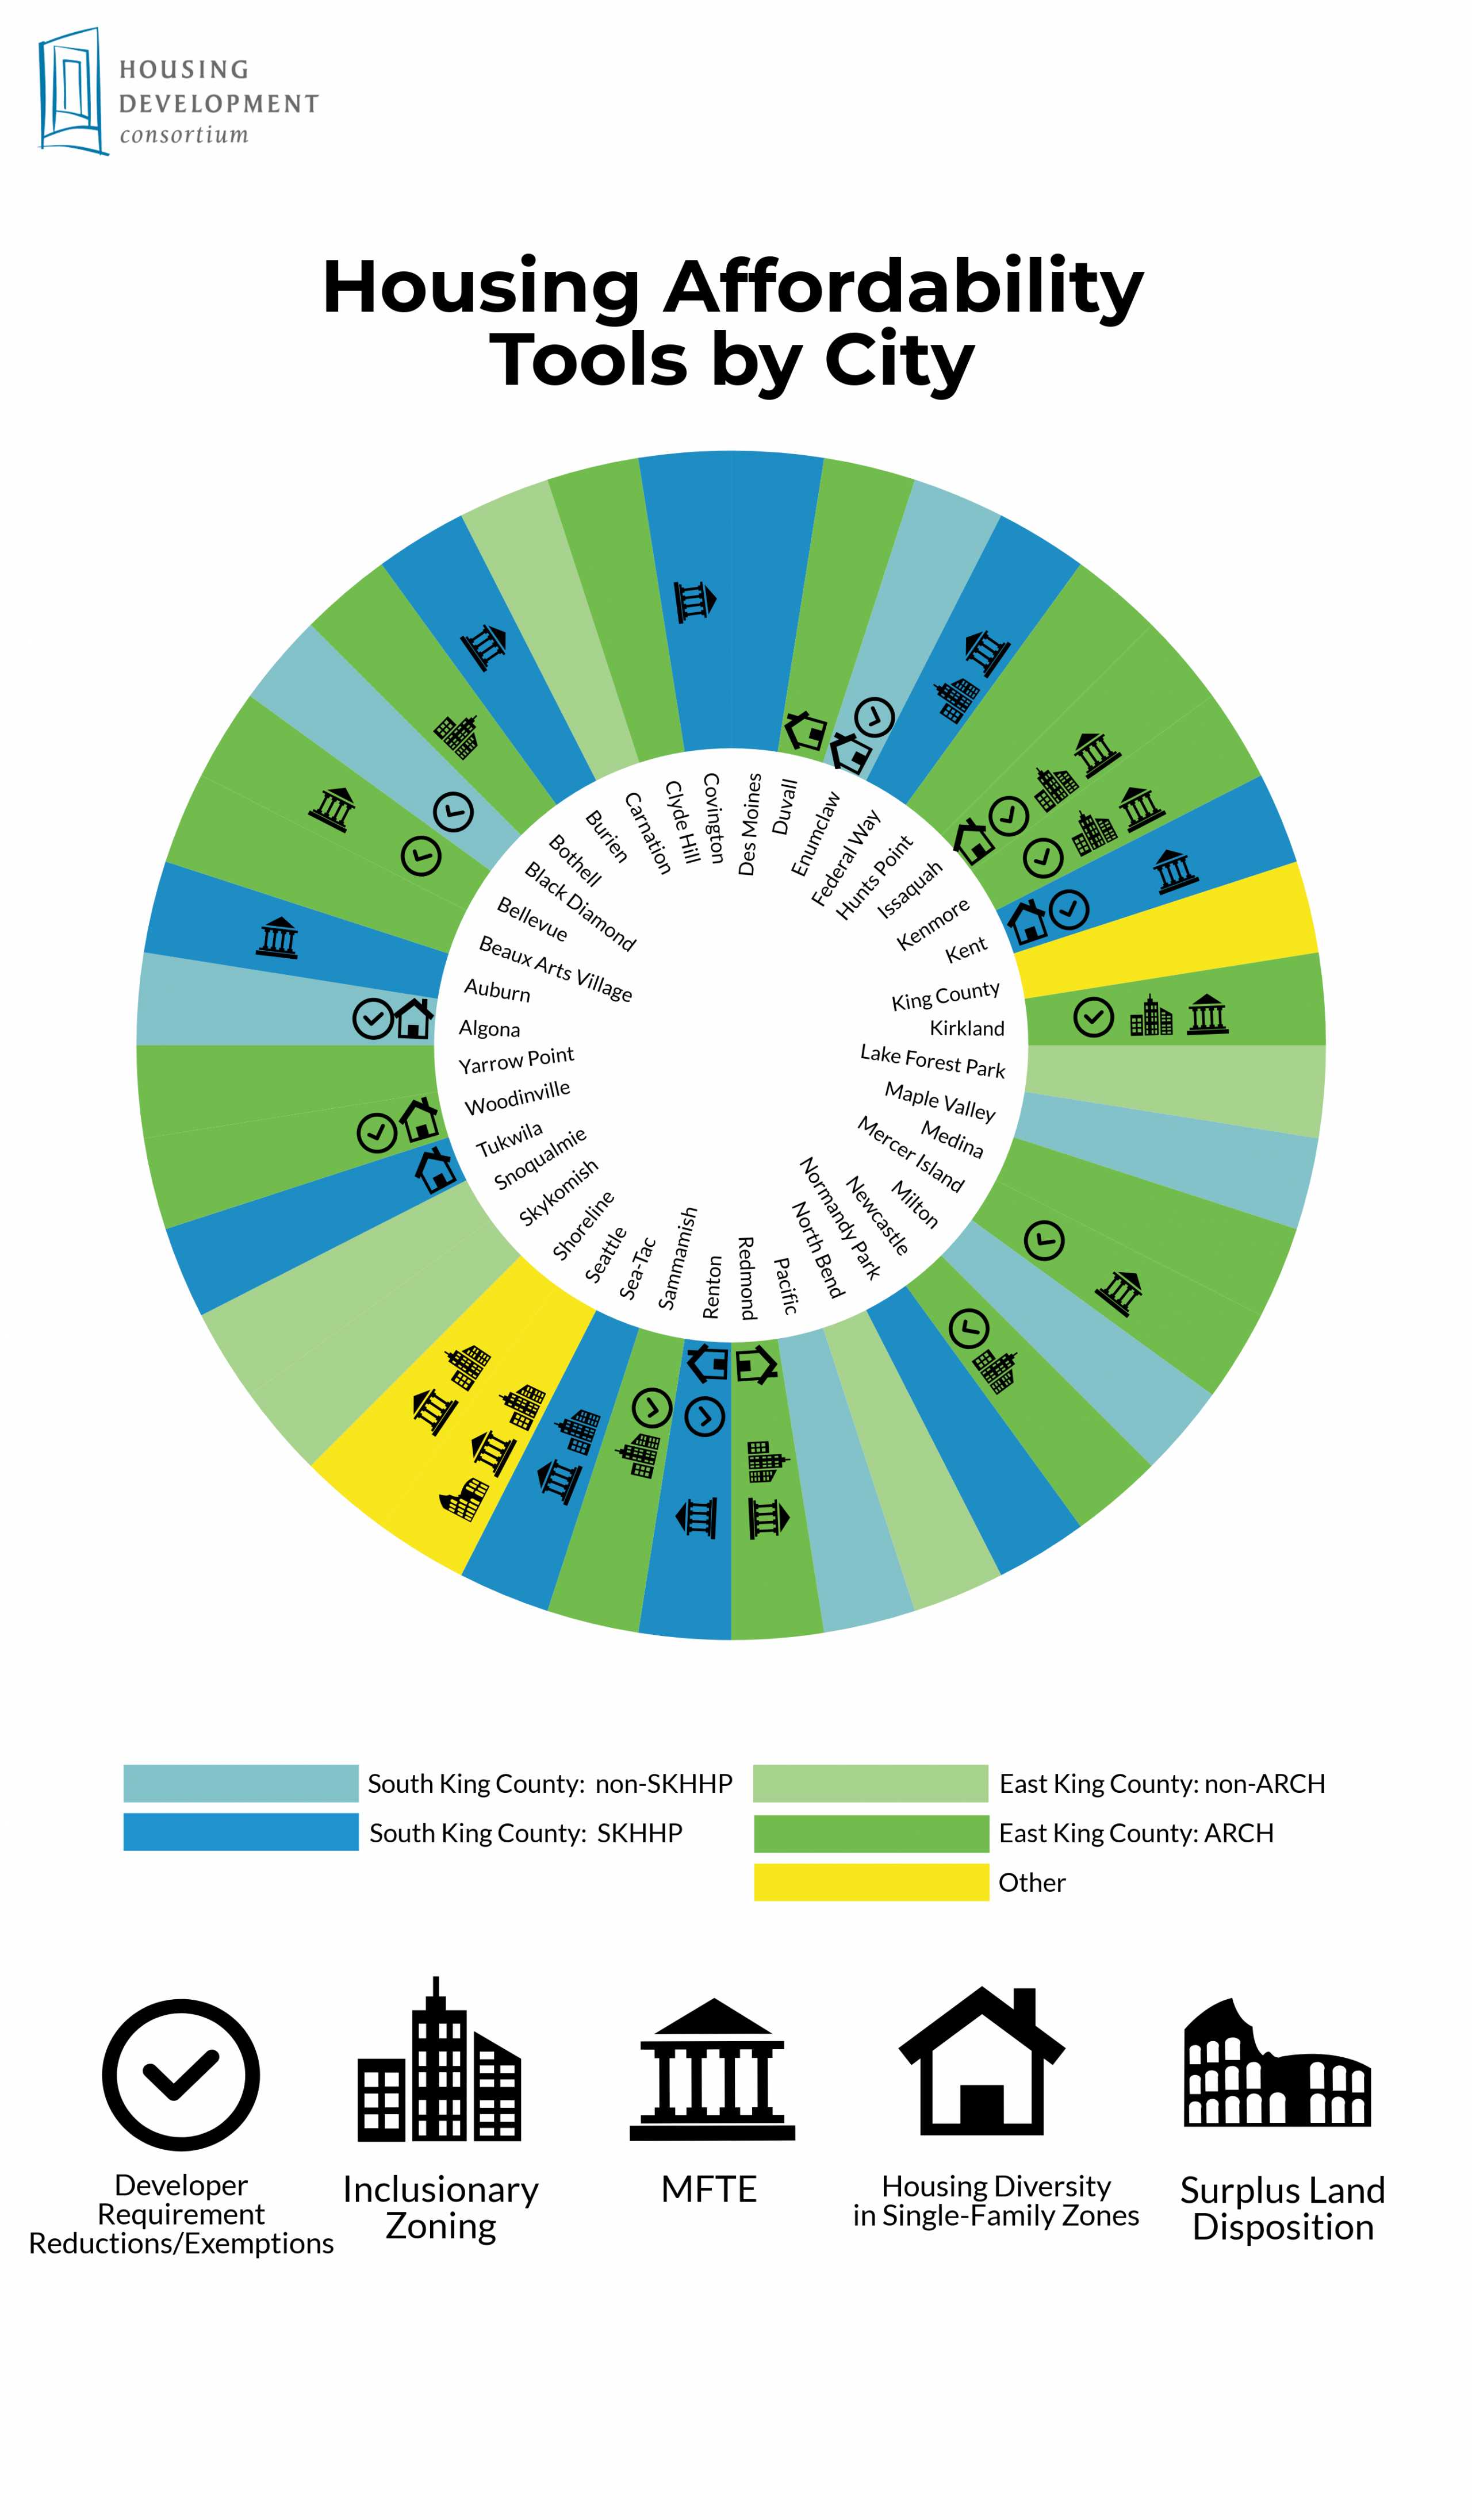 Regional Fragmentation in King County Housing Policy
How are the 39 various municipalities in King County utilizing policy solutions to meet the tremendous need for affordable housing throughout our region? This radial diagram shows which cities have implemented inclusionary zoning programs, surplus land policies, housing options in single-family zones, Multi-Family Tax Exemption, and developer requirement exemptions.
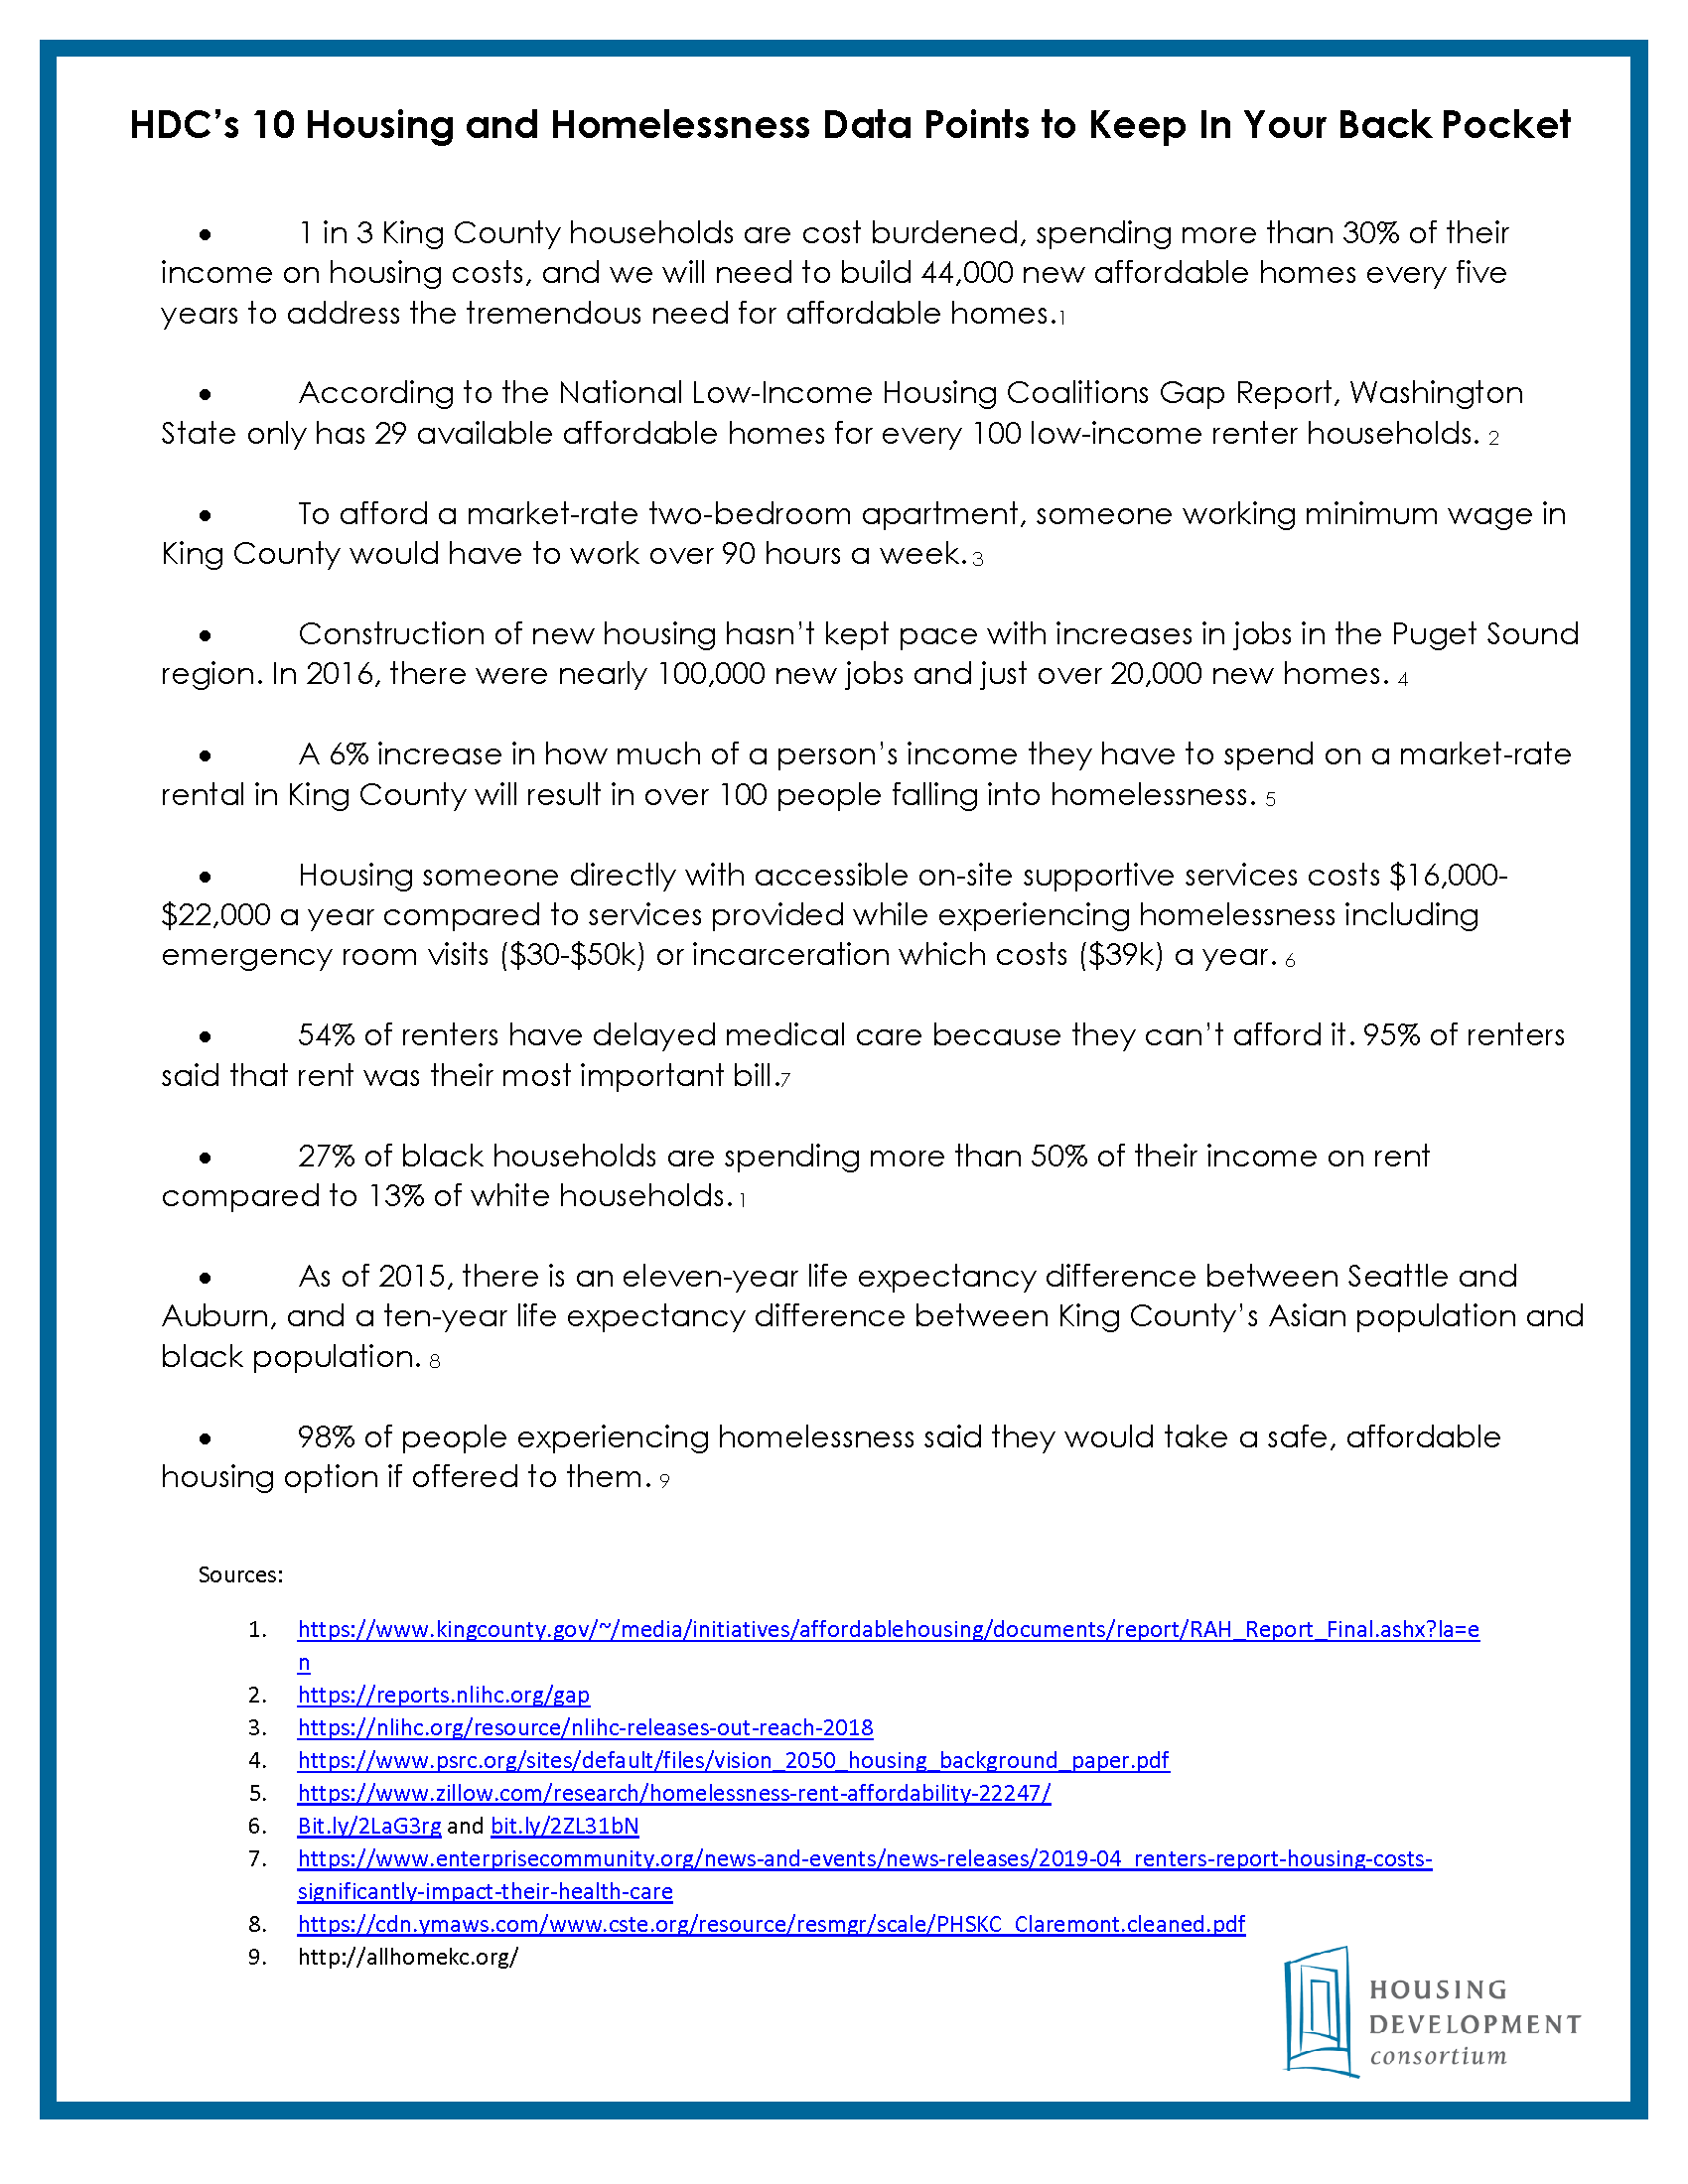
10 Housing and Homelessness Data Points to Keep in Your Back Pocket
click here for pdf version.
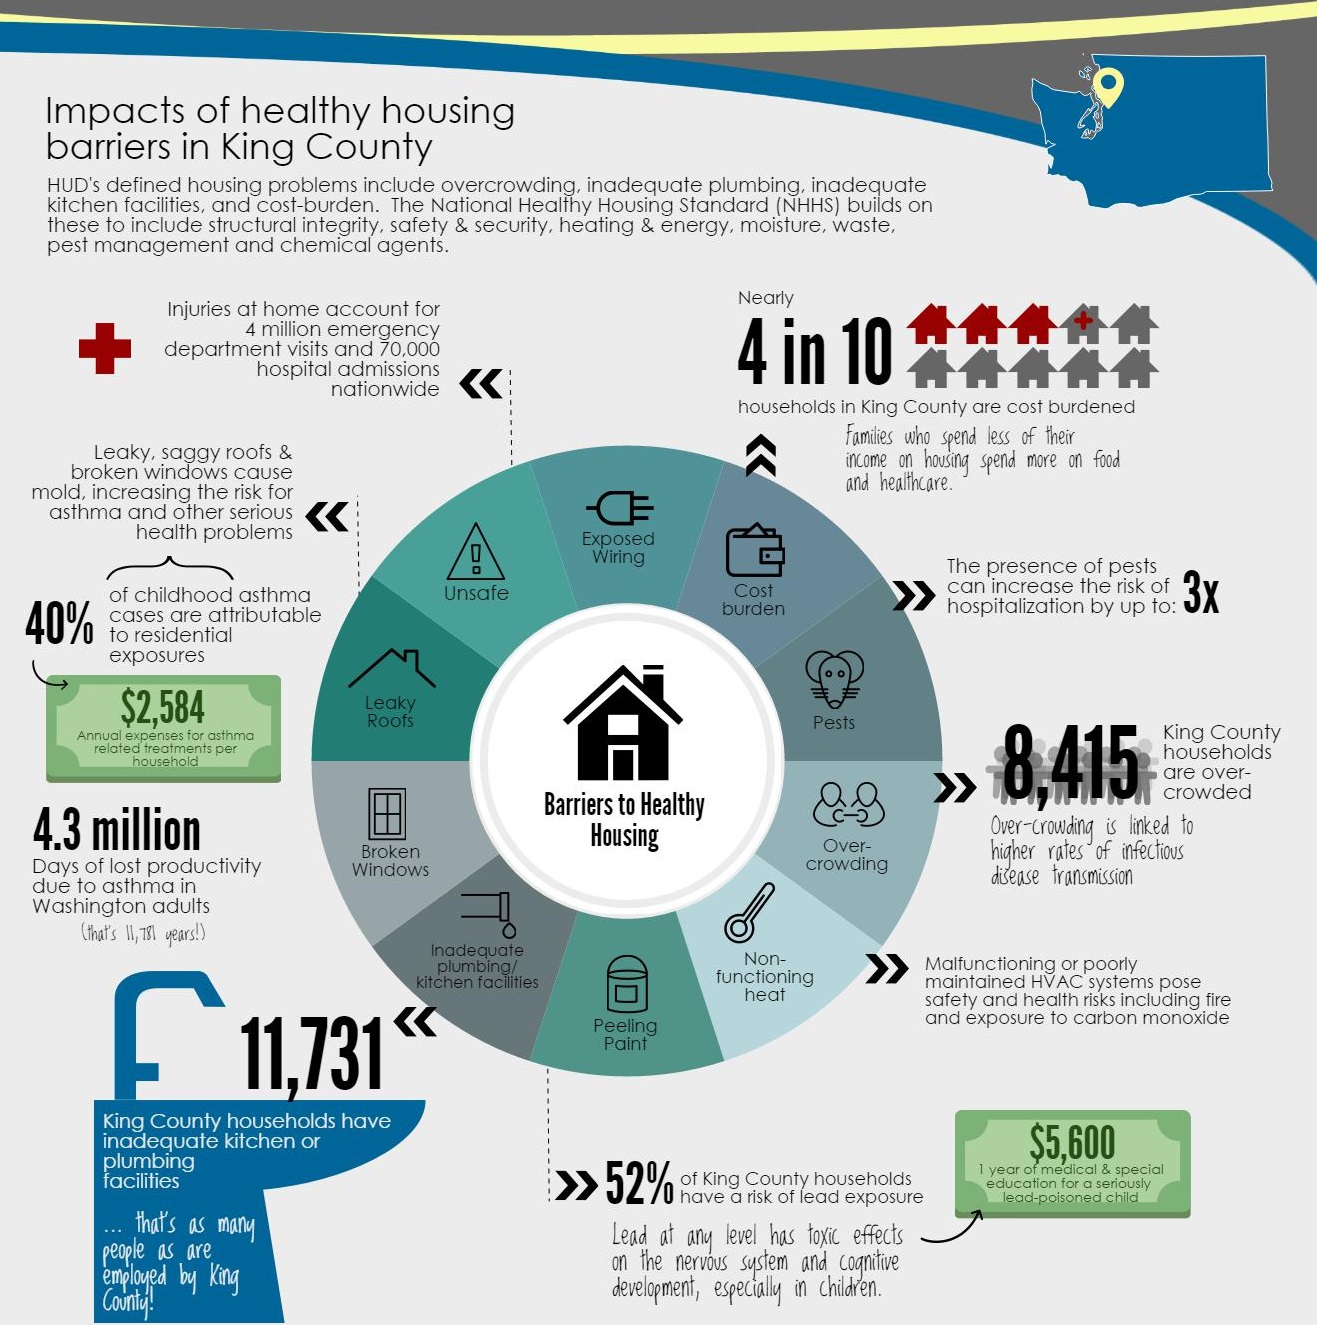 Housing & Health in King County
How does housing affect your health? We’ve got an infographic for every city and subregion in King County- even some CDPs!
For a complete selection of easy-to-print PDF versions, click here.
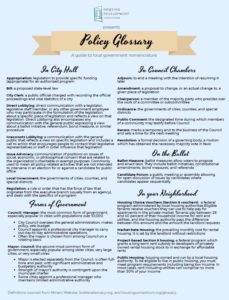 Policy Glossary
A guide to local government nomenclature.
Count Us In 2019 Inforgraphic
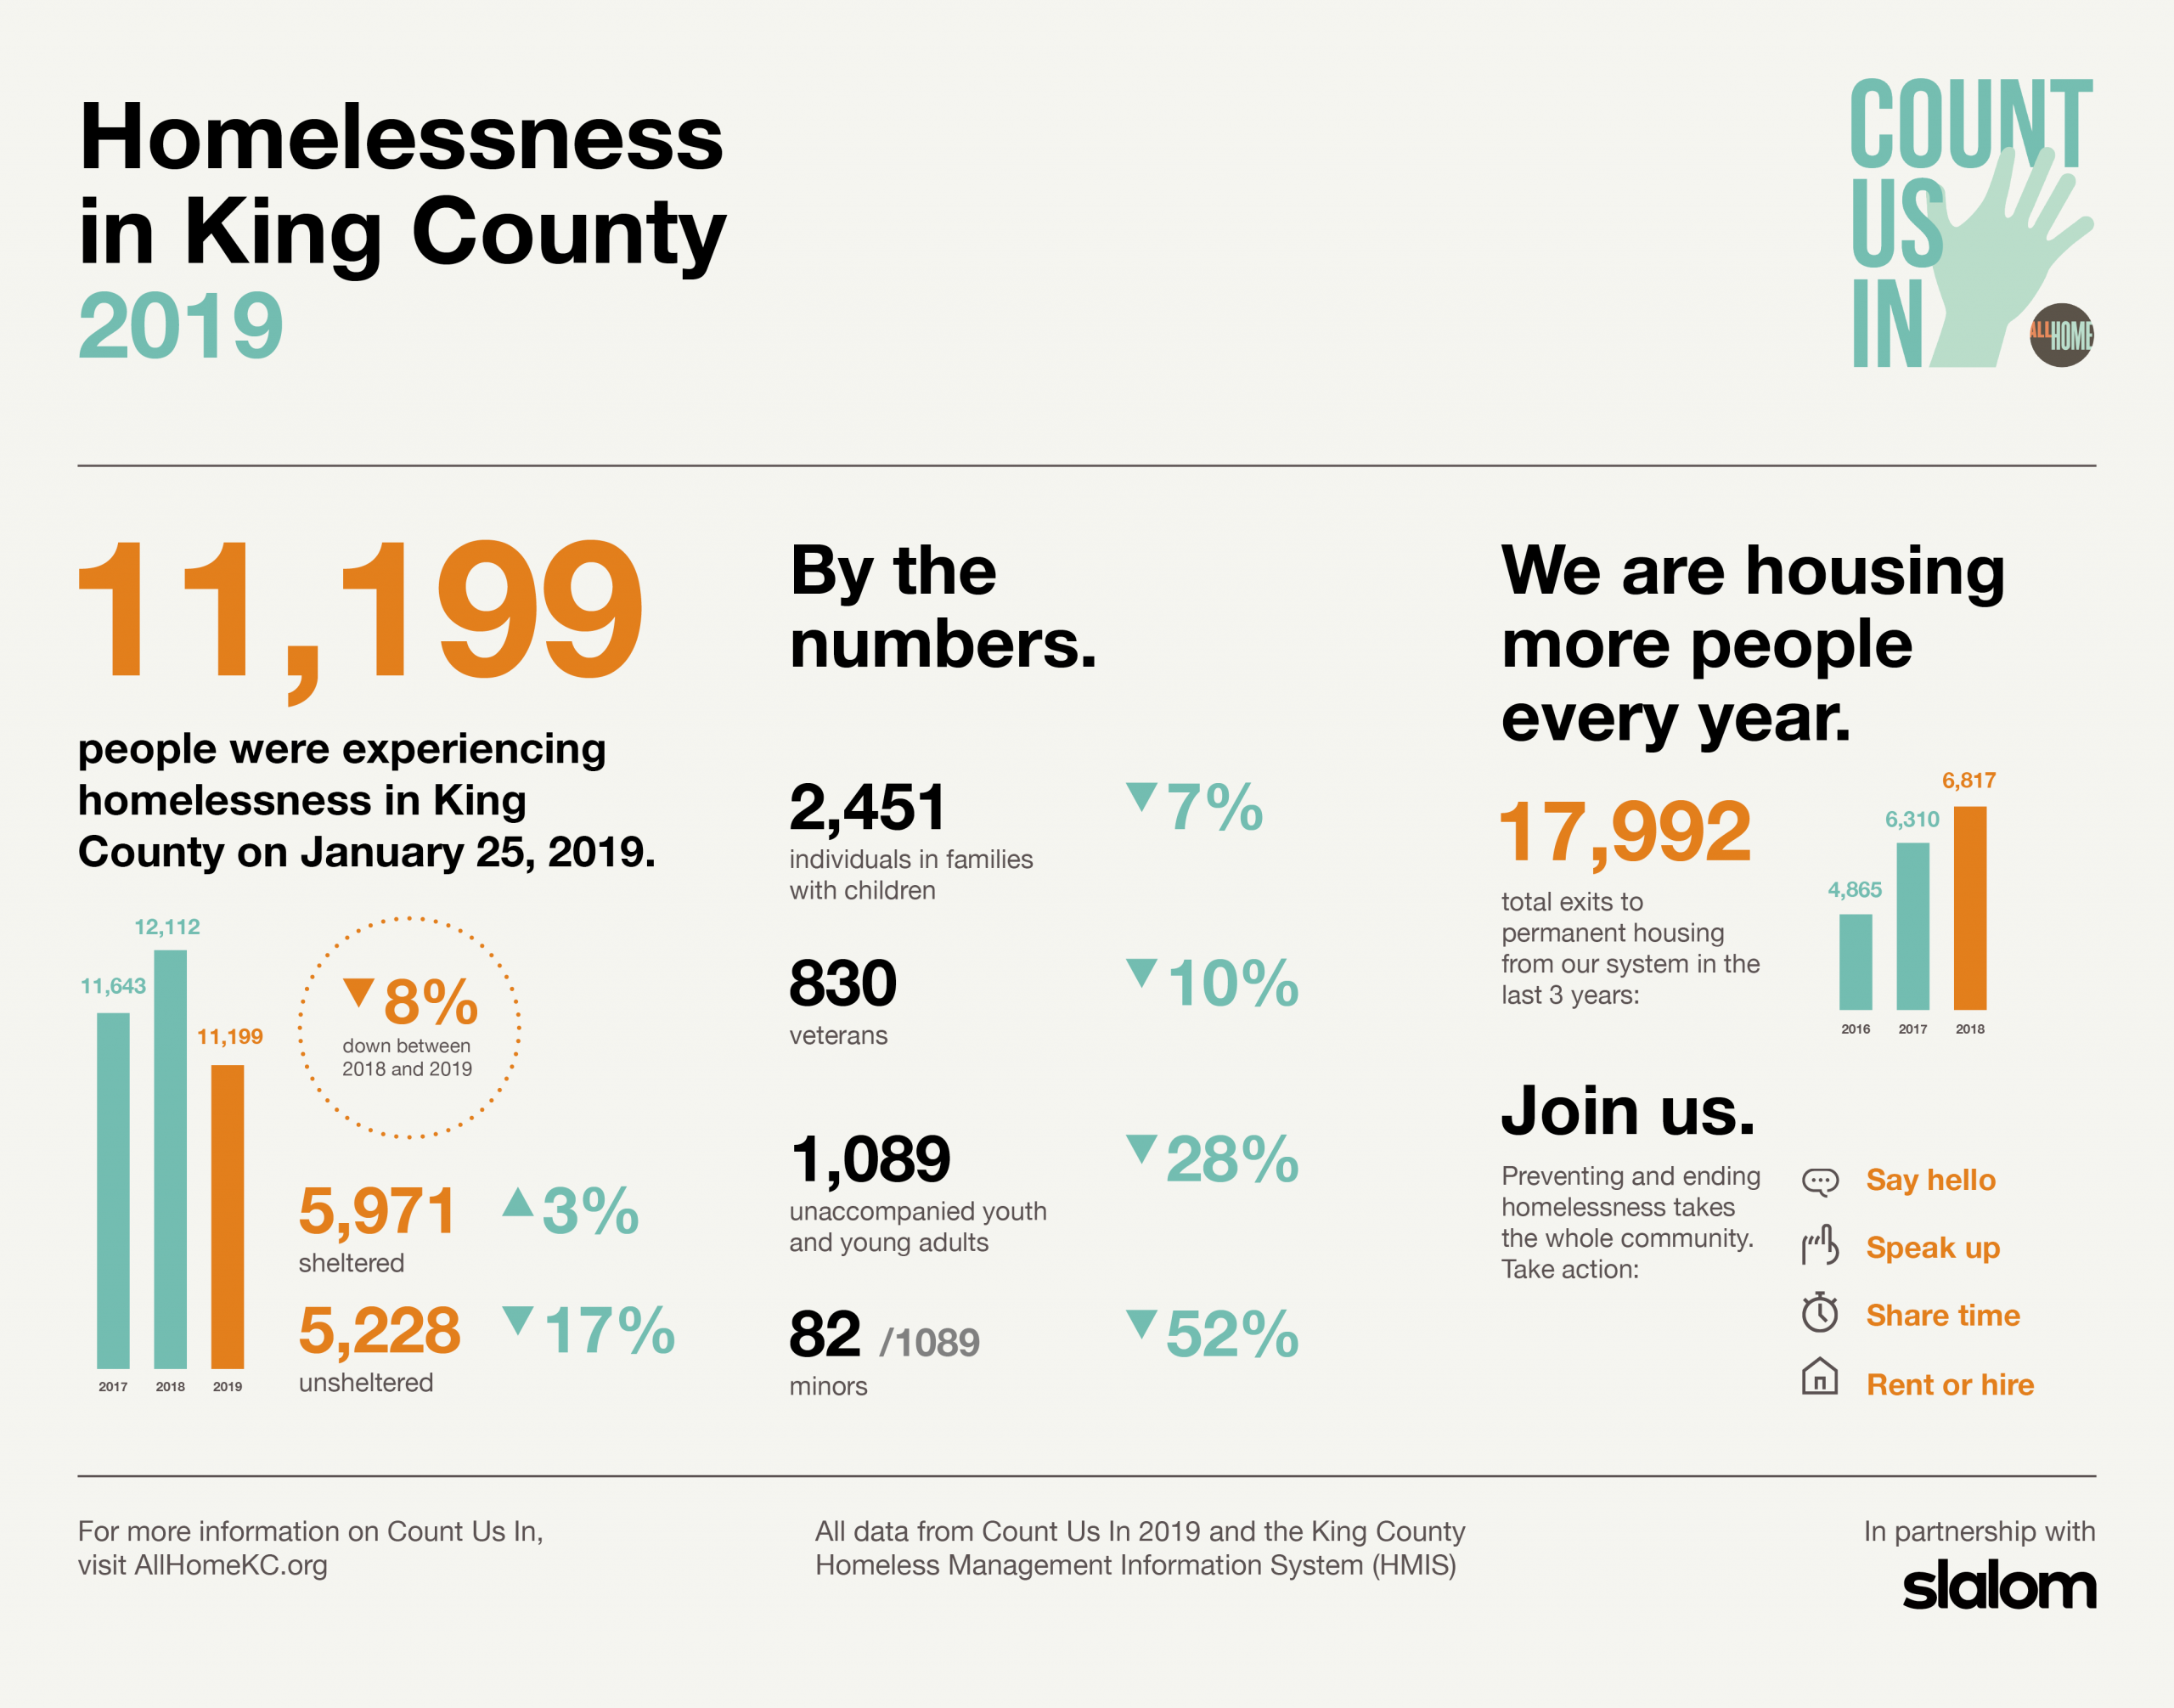
For the first time since 2012, the All Home point-in-time count showed a decrease in the number of people in King County experiencing homelessness. More here.
Eastside Housing Trust Fund Contributions 2017-2018
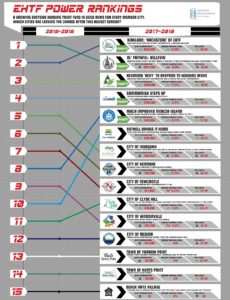 Each budget cycle, 15 eastside cities make contributions to the Eastside Housing Trust fund. See your city’s contribution in our EHTF Power Rankings!
For an easy-to-print PDF version, click here.
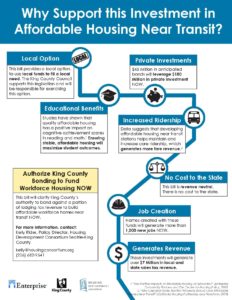 Why Support Investment in Affordable Housing Near Transit?
Affordable housing and transit make our communities livable for people of all incomes. Click the image to enlarge.
For an easy-to-print PDF version, click here.